Machine Learning for Diabetes Risk Prediction
Classification and population segmentation on the CDC BRFSS 2015 survey (253,680 respondents) — individual risk screening via Logistic Regression, and unsupervised health-profile discovery via K-means clustering.
Abstract
The CDC BRFSS 2015 survey records 253,680 respondents across 21 health, lifestyle, and demographic features. Diabetes prevalence is heavily imbalanced, motivating cost-sensitive evaluation and threshold optimisation throughout. This project pursues two objectives under the CRISP-DM framework: individual-level risk prediction through supervised classification, and population-level segmentation through unsupervised clustering.
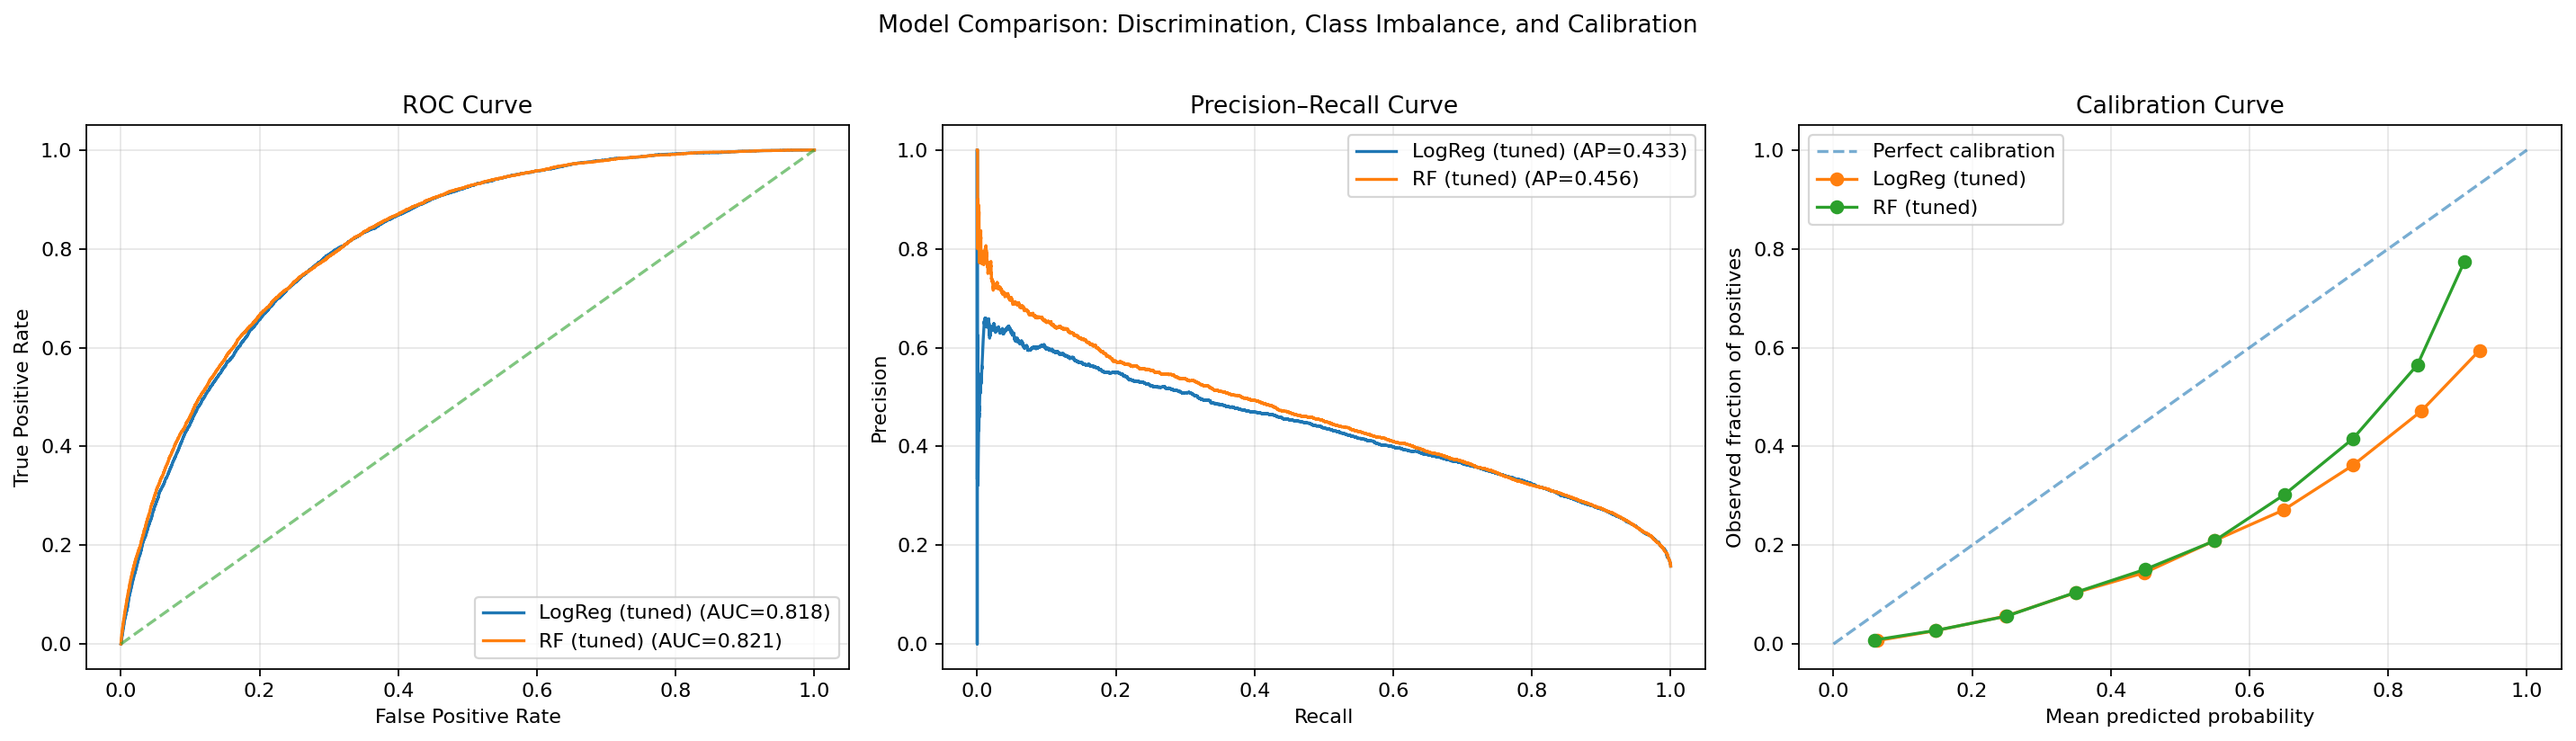
The final Logistic Regression model achieves ROC-AUC 0.818 and at-risk recall 0.761 at an operating threshold of t = 0.48 — selected not for raw accuracy, but for the flatness of its cost curve, which makes deployment behaviour robust to threshold variation. SHAP confirms GenHlth, Age, and BMI as the three dominant drivers. K-means (k = 3) recovers three clinically differentiated population strata, validated externally by chi-square against diabetes labels.
Key Findings
Highlights
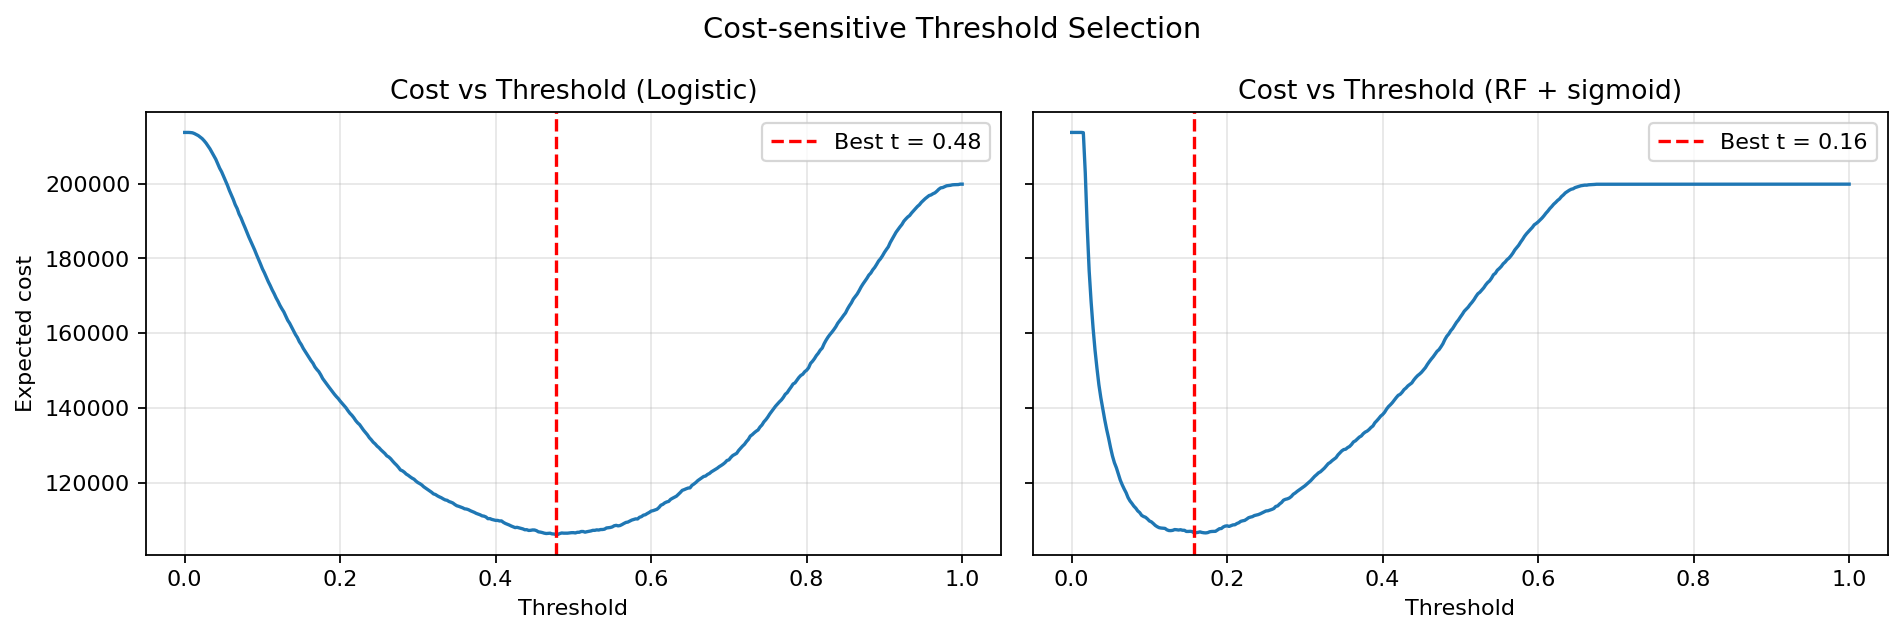
Classification Results
| Model | Variant | ROC-AUC | AP | At-risk Recall | F1 |
|---|---|---|---|---|---|
| LR | Baseline | 0.818 | 0.433 | — | — |
| LR | Tuned · C = 0.05 · t = 0.48 | 0.818 | 0.433 | 0.761 | 0.470 |
| RF | Baseline | 0.818 | 0.453 | — | — |
| RF | Tuned · t = 0.16 | 0.821 | 0.456 | 0.746 | 0.456 |
| LR | + SMOTE | 0.815 | — | 0.753 | 0.468 |
CDC BRFSS 2015 · 253,680 respondents · Binary at-risk label (Diabetes_012 ≥ 1) · Class-weighted training · RFECV retains all 21 features. LR selected on cost-curve robustness, not AUC margin.
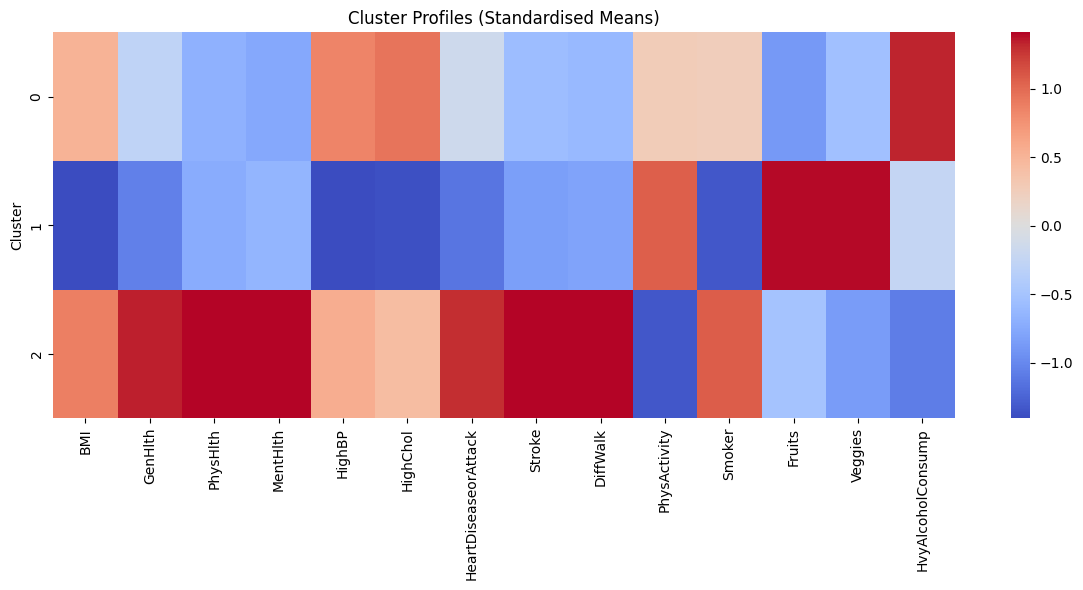
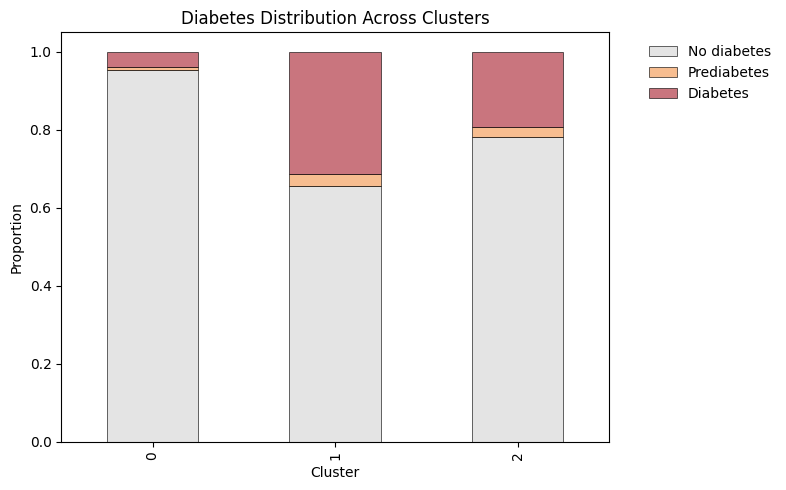
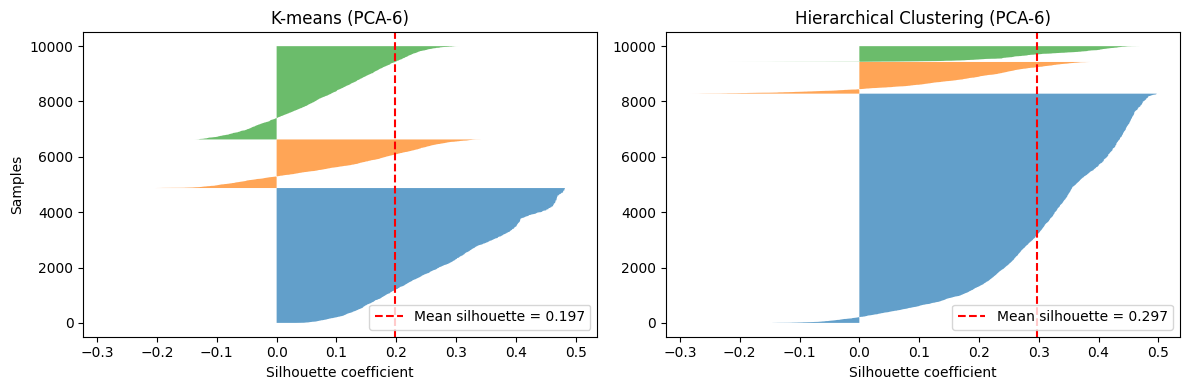
Clustering Results
| Cluster | Label | BMI | GenHlth | HighBP / Chol / CVD | Diabetes Rate | Intervention |
|---|---|---|---|---|---|---|
| 0 | Low Risk | Low | Good | Low | Lowest | Preventive |
| 1 | Lifestyle-driven | Moderate | Moderate | Low–moderate | Moderate | Lifestyle change |
| 2 | High Clinical Burden | High | Poor | High | Highest | Clinical management |
K-means (k = 3) on 14 health and lifestyle features · PCA(6) · Silhouette = 0.197 · External validity confirmed by chi-square against diabetes labels. k selected for stability across PCA representations, not peak silhouette.
Read More
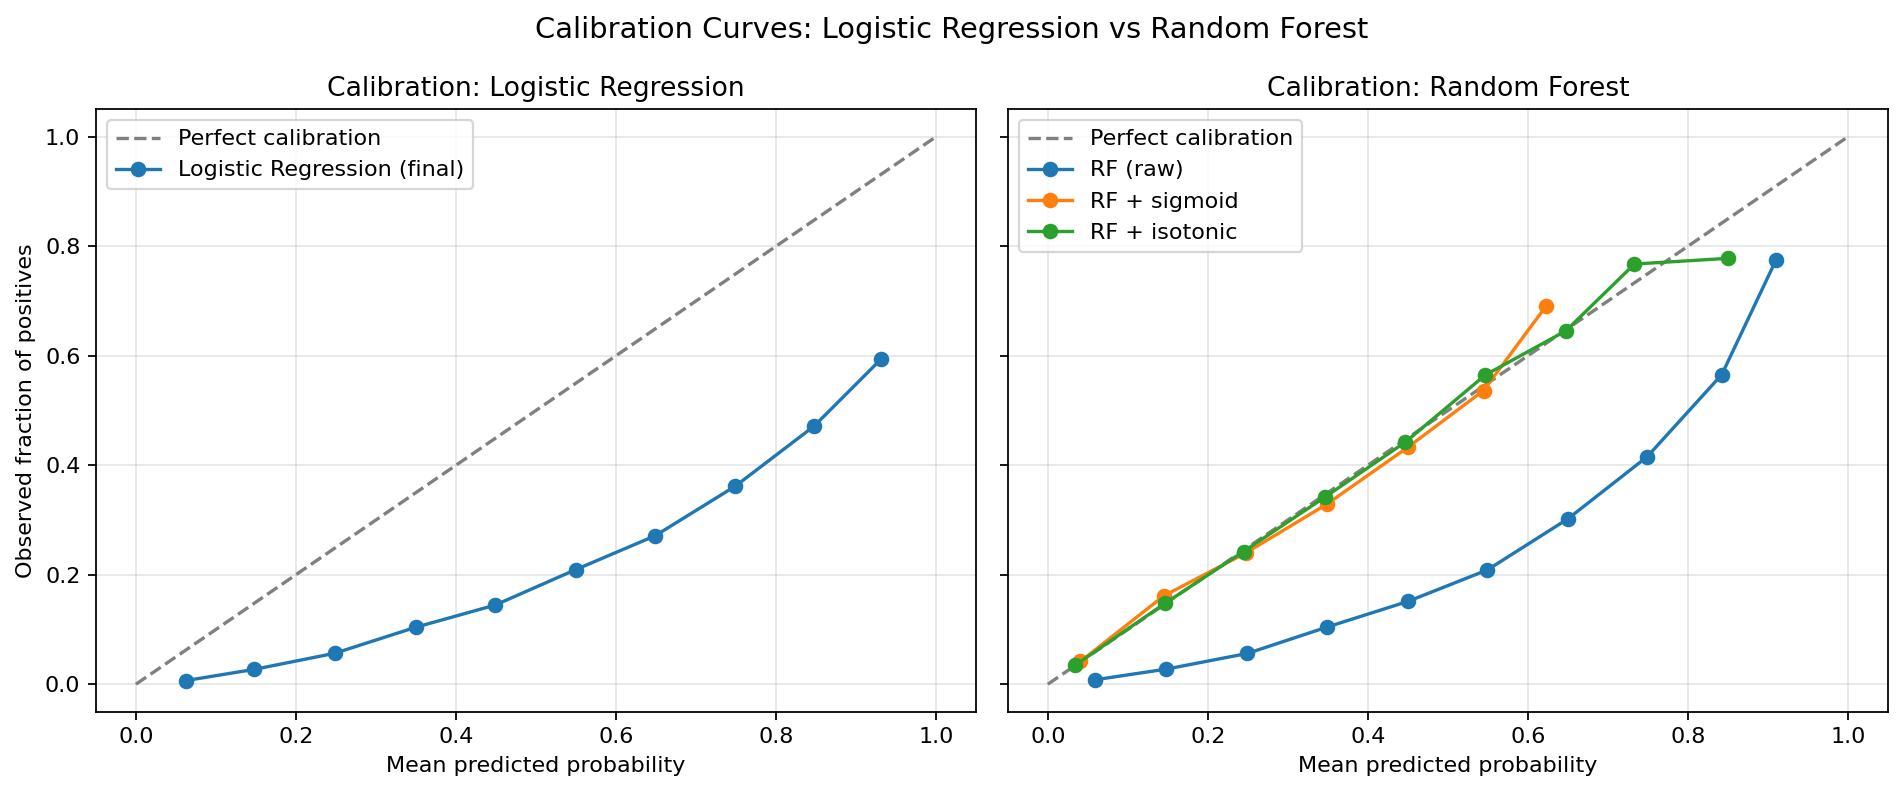
Full analysis covering RFECV feature selection, cost-sensitive threshold experiments, SMOTE vs class-weighting comparison, calibration curves, SHAP deep-dive, and hierarchical vs K-means clustering evaluation — with all 17 figures:
Read the analysis note →